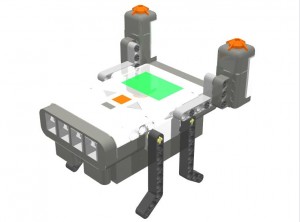
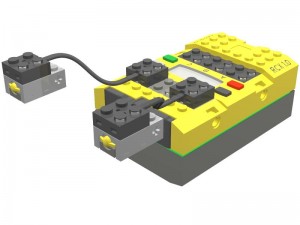
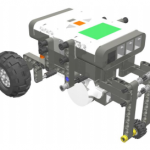
Think of an intelligent way to set up a “voting booth” to gather data, and plot this data on a graph for analysis.
What sensor(s) can be used to collecting this data? Touch sensor? IR sensor?
How could the results be stored? How should they be displayed?
Resources
The following two tabs change content below.


CEEO
The Tufts Center for Engineering Education and Outreach (CEEO) in Boston, Massachusetts, is dedicated to improving engineering education in the classroom, from Kindergarten to college. The Center houses faculty, staff, and graduate students from engineering disciplines and the education department.
Latest posts by CEEO (see all)
- Chair for Mr Bear - 21 August 2020
- Assistive Technology: Making Lives Easier - 20 August 2020
- Sturdy Tower - 14 June 2020
- Going the Distance - 21 May 2020
- GPS accuracy testing with LEGO bricks - 10 September 2015
